Sales Business Intelligence for Principals and Distributors
Table of Contents
In today’s competitive market, sales data supported by Business Intelligence (BI) tools can help companies to gain bigger market share and profit, increase productivity and operational efficiency, while also understanding industry trends and customer behavior.
What is Business Intelligence (BI)?
Business Intelligence is a business system that uses data visualization, reports, and data analysis through an online platform. Analysis can be in the form of marketing strategies, operational efficiency, market pricing, profits, employee performance, sales forecasting, and other data.
The objective is to get comprehensive business insights in the form of data visualizations, dashboards, and reports; for c-level executives, managers, and data analysts. To do this well, companies need systems that can centralize and store all of their data, so employees can find the data they need quickly, anywhere, and anytime.
Read more: Management Report System for Distributors and Principals
Why You Need Sales Business Intelligence
To increase sales, companies would benefit from the help of sales software to collect sales data from individual salesmen to all company employees. The data will be used to identify the industry’s best practices and to analyze what sales strategies are working in the market.
Benefits of Sales Business Intelligence
- Identify metrics that need to be improved to maximize sales performance
- Provides visibility into which products are selling best in the market
- Streamline operational efficiency and increase productivity
- Analyzing customer behavior patterns and adapt the strategies to consumption trends in the market
- Identify market potential from sales data insights

Advotics Sales Business Intelligence
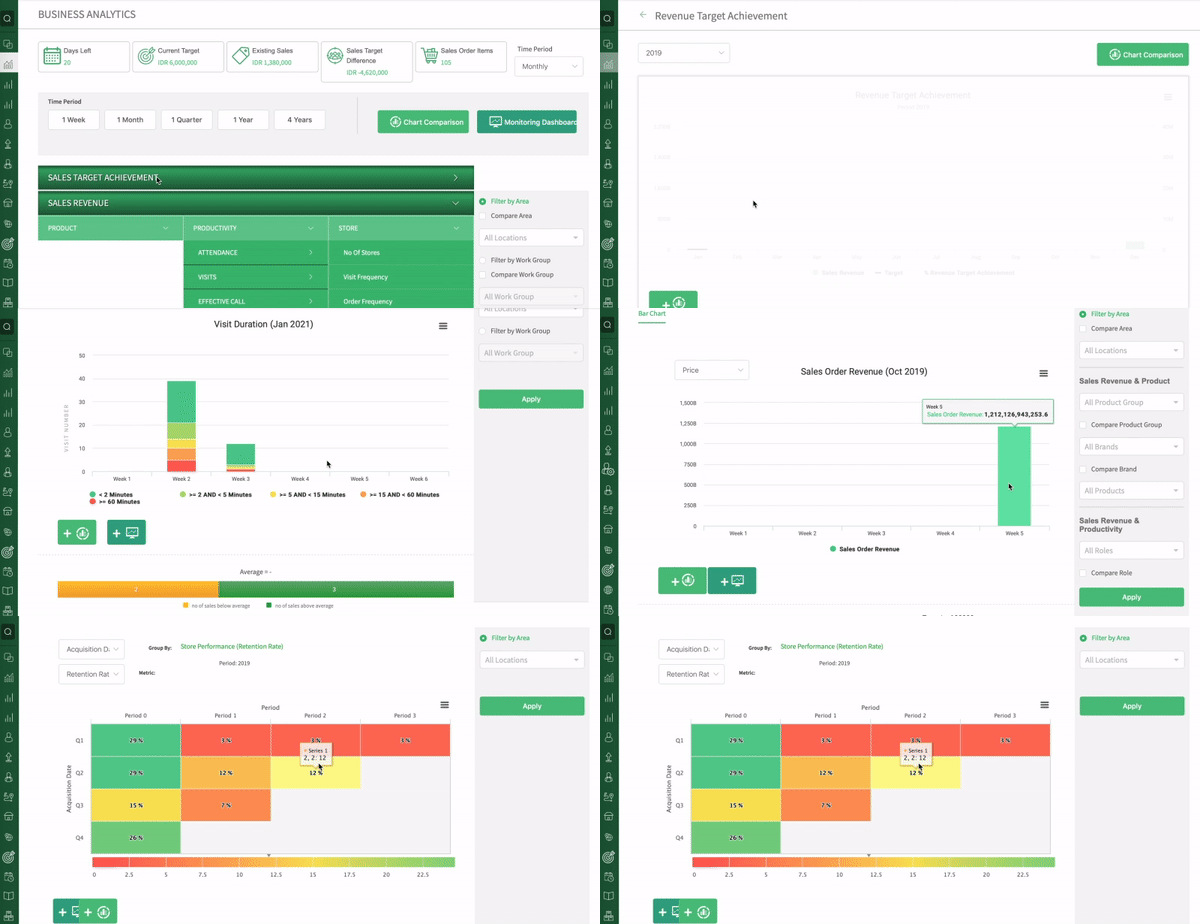
The Business Intelligence tool in Advotics Distribution Management System (DMS) dissects sales achievement into supporting factors. For example, employee productivity can be broken down into attendance, number of visits, and % effective calls. If it turns out that the level of attendance and the number of visits to the store has been optimal but the target has not been reached, maybe the salesman selling method needs to be improved in order to generate a higher % effective call.
- Revenue Target Achievement = income target
- KPI Target Achievement = staff’s KPI achievement
- Sales Revenue = value of sales order and the number of units ordered
- Visit Number, Duration, Frequency = salesman visits to shops
- Effective Call Number & Revenue = store visits that generated sales orders
- No. stores = number of registered customers
- Order Revenue & Frequency = value and frequency of orders
- Store Performance = customer past sales order percentages
- Monitoring Dashboard & Chart Comparison = custom chart comparison by user


